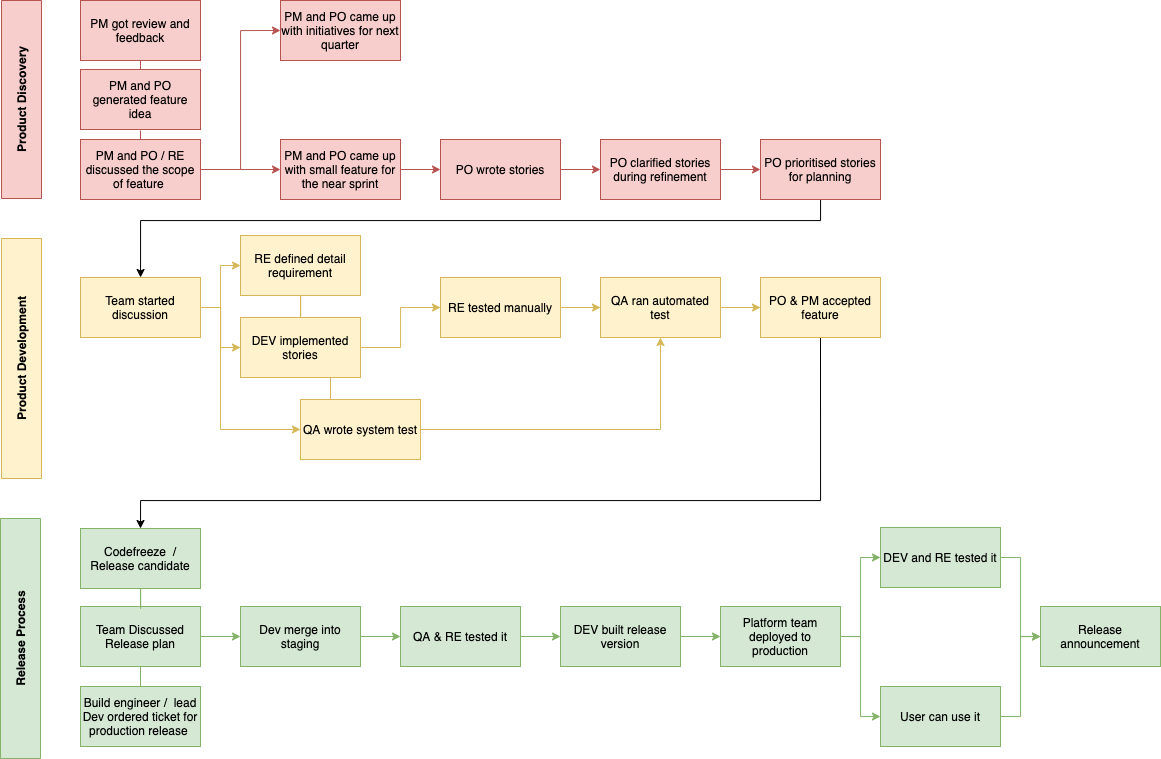
Value Stream Map
Visualize the steps an organization takes to create & deliver value to customers in order to help eliminate "waste." A common use case is a path to production and product development life cycle.
Phases
Suggested Time
1-2 hours
Participants
Core team, subject matter experts (as needed)
Why do it?
- To identify how we could deliver user and/or business value faster and/or more often by identifying delays, unnecessary features and hand-offs.
- To understand the steps and people involved in a process so that we can improve collaboration and preclude potential blockers.
When to do it?
This activity can be done as early as the Kickoff if there are concerns about many teams creating one system or known problems in product development life cycle. Otherwise, it can be done as part of technical Discovery, Framing, or any time the team finds itself bogged down with an inefficient process.
What supplies are needed?
- Whiteboard or digital version like Miro
- Sticky notes
- Sharpies / markers
How to Use this Method
Sample Agenda & Prompts
-
Explain the purpose of the workshop.
Using product development lifecycle as an example, you might say something like:
“To identify our product development life cycle, we’ll follow a feature from the moment user gives feedback (e.g. a story is written) to its deployment on production. We’ll focus on the current deployment process before the future state, because understanding what’s happening now will surface real blockers and stakeholders faster than an idealized workflow. Additionally, we want to discover not only the steps, but also the roles and the lead time of each steps.”
-
Start with the current product development process. On one end of the whiteboard or section of the digital collaboration board, write the first step of your chosen value stream. On the other end, write the last step.
For product development life cycle, put “User Feedback” as a first step and “Release to Prod” as a last step.
Tip: If the team having trouble determining the end point, ask a question like “when would we consider the job done for this journey?”
-
Have the group identify the high-level steps that take place from beginning to end in the value stream, being as detailed as possible. Write each step on a sticky note and place it in order on the whiteboard. Iterate as needed.
Tip: Ideally you’ll move from start to end but don’t get hung up on the order because you can easily move the sticky notes around. The idea is just to start generating as a team.
-
Once the group is satisfied they’ve captured all of the high-level steps in the right order, loop through the flow again. This time, capture the following information about each step on another sticky note or on the whiteboard:
- What happens at this step?
- Where does it happen?
- Who is responsible for this step? (e.g. is it automated or manual; when do they need to be involved; are they an employee or third party)
- When can this step happen? (e.g. what must happen before it can proceed)
- How long does this step take? (e.g. process time)
- How much lead time is required?
- What works well or is painful about this step?
- How do we know this step is done?
- How long does the whole value stream take and how does the team feel about it?
Tip: These are example questions. Use whatever “lens data” that’s appropriate for your content to shape your picture of the problem. Care about handoffs? Capture them explicitly. Want to visualize system touch-points? Add in Service Blueprint-type details. In short, capture what matters.
-
Have the team take a step back to review the flow and adjust anything that feels incorrect.
-
When the value stream map feels the right visualization of current processes, calculate the total lead time for the whole process and discuss it with the team to find area that can be improved.
-
Repeat steps 2-6 for the “to be” process.
Success/Expected Outcomes
You know you’re done when you have a visual value stream on the whiteboard and the team feels confident it accurately represents the current process.
Facilitator Notes & Tips
Some teams are sensitive to the idea of calling out “waste” in their processes. Another way to frame the purpose of this activity is to call it an opportunity to increase efficiency.
The Seven Wastes of Product Development
- Partially done work (because we cannot release it)
- Extra features (because they are unnecessary right now or perhaps always)
- Relearning (because this takes time away from learning new things and releasing working software)
- Hand-offs (because this leads to waiting, and adds communication)
- Delays (because this slows the team down)
- Task switching (because it leads to context switching which reduces our focus and slows us down)
- Defects (because this adds work cycles)
Variations
Path-to-production exercise
Real World Examples
Example of a product development life cycle

Recommended Reading
Value Stream Mapping: How to Visualize Work and Align Leadership for Organizational Transformation by Mike Osterling & Karen Martin
The Seven Wastes of Software Development - Blog post by Michael Szul
Software Development Waste - Conference paper by Todd Sedano
Lean Software Development: An Agile Toolkit by Mary Poppendieck & Tom Poppendieck
DevOps Processes: Value Stream Mapping by Mandy Storbakken