Application Observability
Detecting Abnormal Behavior with Tanzu Observability
Howard Yoo & Zac Bergquist
As more and more sources of metrics become available for monitoring, the problem shifts from whether or not right metrics are available to whether we can possibly manage all of this data. Today’s systems consist of many servers, virtual machines, containers, and microservices, and it is becoming challenging to keep up with the increasing number of charts and dashboards that accompany these sources.
One approach to managing this situation is to delegate some of the monitoring work to machines. Anomoly detection is an emerging solution that can be used to detect abnormal behavior without requiring humans to define and maintain the set of conditions that are deemed abnormal.
Detecting Anomolies with Standard Deviation
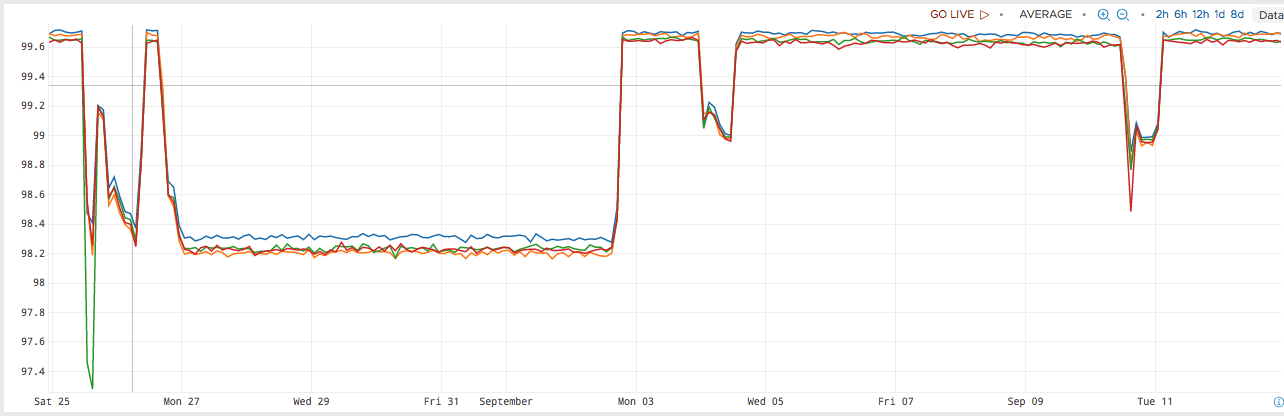
The most popular way to detect abnormal patterns in a set of data is to calculate how much the current value of a metric deviates from prior values. For example, suppose we query for the idle CPU for a particular service:
ts(cpu.usage.idle, not cpu=cpu-total)
This query produces the following graph:
Next, we form a query to calculate how much the current value of the metric differs from the standard deviation over some time window (1 day in this example):
data = ts(cpu.usage.idle, not cpu=cpu-total)deviation = (${data} - mavg(1d, ${data})) / sqrt(mvar(1d, ${data}))
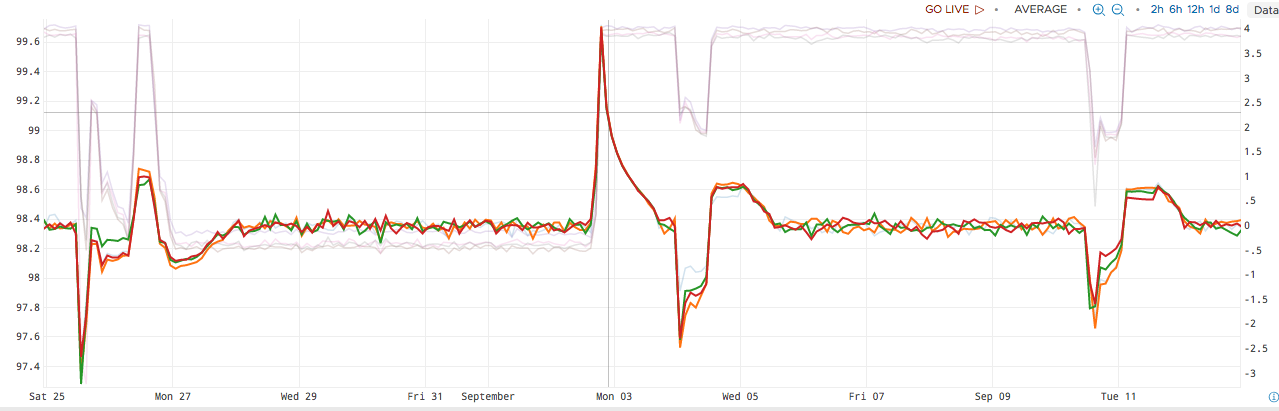
In this image, the original metric is faded out, and the highlighted metric shows how much the current value differs from standard. During normal operation, This value mostly hovers around 0, as there is a very small amount of deviation. Note that this holds true even though the underlying metric moves from approximately 98.2 to 99.6 - we only see a major change in the deviation during the transition.
This approach leaves plenty of room for improvement. The query is long and difficult to understand. Additionally, the user must explicitly set the condition under which an alert will be fired. For example, we can see that two alerts are generated if we alert when the absolute value of the deviation is greater than 1.5, indicated by the red vertical slices in the following diagram:
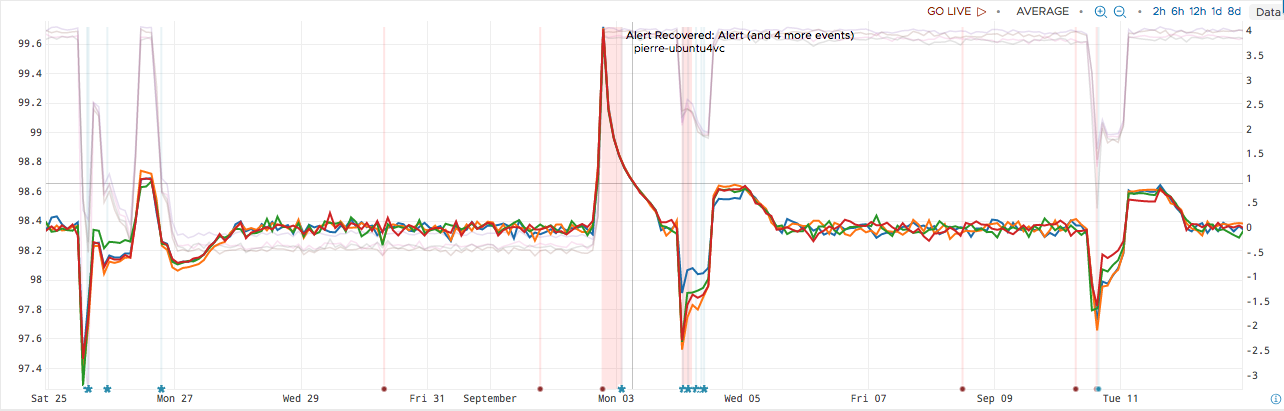
As you can see, setting the alert threshold correctly takes some adjustment. With a value of 1.5, the alert was not sensitive enough to detect the anomolies at the beginning and end of the graph depicted here.
Detecting Anomolies with the Anomalous Function
Wavefront Query Language (WQL) includes an
anomalous function that can be
used to simplify this process. The syntax of the function is:
anomalous(testWindow, confidence, expression)
testWindowis the length of the moving time window to check for anomalous points.confidenceis a number from 0.0 to 1.0 that expresses the confidence factor for determining the range of expected values.
Using this knowledge, we can improve upon our previous query:
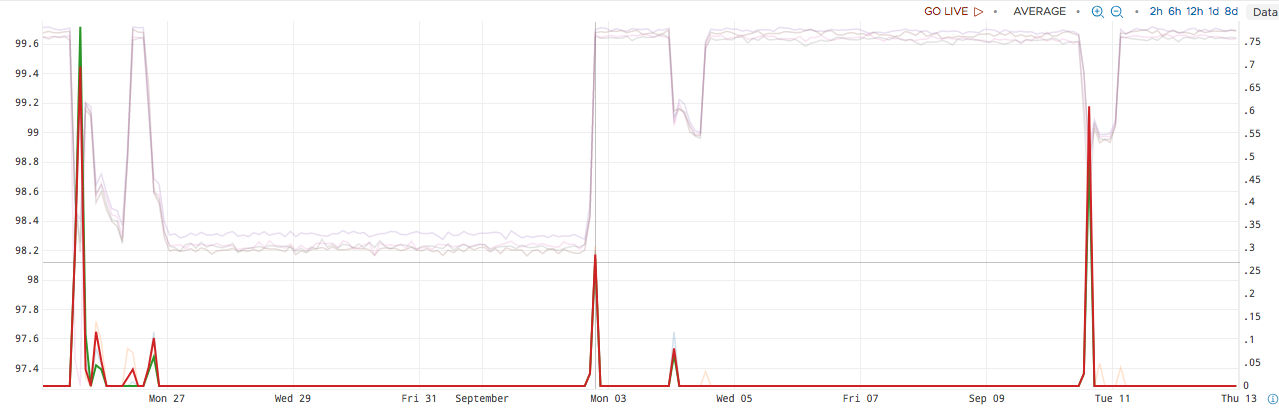
interpolate(anomalous(1h, 0.99, ts(cpu.usage.idle, not cpu=cpu-total)))
This query returns the percentage of anomalous points in the last one hour with a confidence of 99% By default, it predicts the expected values of the metric using the actual values over the past day. This behavior can be customized with additional optional parameters.
The results of this query show a spike that lines up with each anomoly in the underlying data.
Conclusion
Anomaly detection can be a convenient way to apply alerting logic to a large number of metrics without investing large amounts of time understanding each individual metric and defining what normal operation looks like. This is especially useful in cases where:
- large amounts of trial and error are required to determine when an alert should be raised
- you need to apply alerts to a system where there are a many metrics and you have limited knowledge about how they should behave
- the definition of “normal” changes over time
As with any technology, this solution shouldn’t be used in all cases, as the results will vary with the query parameters and patterns in the data. If you are intimately familiar with the underlying data and the conditions which should trigger an alert, you will likely find better results building your own query. Anomoly detection is a promising technology that deserves a place in your observability toolkit.